Summarizing
The steps described in this chapter form part of a layout. Changes to the layout are not saved to the database automatically and must be saved manually by the user.
Creating Summary Activities
Summary activities are created in Project Summit without existing in the source schedule by a) collapsing swimlanes or b) merging activities. They are distinct from LOE's, hammocks, WBS summaries, or summary bars in the following ways:
Feature | Description |
|---|---|
Logic | While collapsing swimlanes or manually merging, logic coming in and out of the summarized activities is maintained according to a series of rules and algorithms. The links to or from summary activities are colored by the lowest criticality of the predecessor and successor at the detailed level. For example, if the predecessor at the detailed level is critical and the successor is near-critical, the link is colored near-critical (orange). If summarizing generates multiple links between summaries, only the most stringent link between those summaries is retained. |
Showing Non-work via Necking | If the summary activity contains a period during which no work took place, then that period of the summary bar is shown using necking. Examples include a period with no logic, a period with logic but not adding float (e.g., a lag or constraint), a period with logic and adding float (e.g., a planned-date or gap), and a non-work period (e.g., a weekend, a holiday, or a shutdown window, etc.). |
Criticality | Portions of summary activities that correspond to critical or near-critical activities are colored red or orange accordingly. Default thresholds for criticality are based on float (for NetPoint files) or total float (for P6 files) values:
|
Collapsing/Expanding Swimlanes

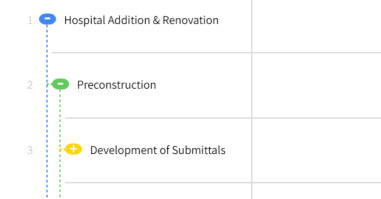
A swimlane with a "+" is a summary and can be expanded. A swimlane with a "-" contains detail and can be collapsed. This is useful for drilling into detail or vice versa. A swimlane that has been collapsed into a summary can be distinguished from a regular activity by a diagonal pattern.

The name of the summary is taken from the swimlane (i.e., WBS) itself. The start, finish, and duration in calendar days between the two are taken from all the activities in the lane.
To expand a swimlane, move the cursor over the "+" until it turns into a hand and click with the mouse.
To collapse a swimlane, move the cursor over the "-" until it turns into a hand and click with the mouse.
To collapse or expand the entire hierarchy to the same level, click the Layers icon :Layers: above the first swimlane and choose the desired level.
Collapsing a Terminal Swimlane
When a swimlane at the lowest possible level is collapsed (no further sub-lanes or children underneath it), the swimlane itself still persists in the hierarchy, and all activities underneath it are replaced with a single summary bar.
Collapsing an Intermediate Swimlane
When a swimlane with other sub-lanes or children beneath it is collapsed, each child lane is removed from the hierarchy and replaced with a summary, which all get placed in the parent swimlane.
Activities assigned to the parent swimlane rather than a sub-lane underneath it will remain as activities and not be included in the summary.
Milestones are not included when collapsing swimlanes. To handle them, see Rolling-up/Hiding Milestones below.
Manually Merging Activities
Activities and milestones can be manually selected and "merged" together to create summary activities distinct from the swimlane hierarchy. To do so:
Choose the Select Tool from the toolbar.
Click on an activity bar or milestone shape.
Press and hold the SHIFT key on the keyboard.
Click on the next activity bar or milestone shape.
Repeat step 4 until all activities or milestones have been selected.
Right-click on any of the selected objects and choose Summarize from the pop-up menu.
To break apart a summary activity, right-click and choose Unsummarize. This cannot be done for summary activities created by collapsing swimlanes.
Editing Descriptions
To edit the description of an activity, milestone, benchmark, or summary activity, double-click the text directly on the canvas.
Rolling-up/Hiding Milestones
As swimlanes are collapsed, all milestones or benchmarks will be hidden by default. To include milestones at a summary level:
Choose the Select Tool from the toolbar.
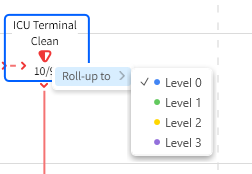
Right-click on the milestone in the assigned lane and choose Roll-up to.
Choose the highest level where you want the milestone to be visible.
To re-hide a milestone, repeat steps 1-3.
A milestone will always show up in the checked level + every level underneath the one checked.

Questions | Answers |
|---|---|
What does the check mean? | The level with the check is the highest level a milestone will show up in when collapsing swimlanes (rolling-up). |
Why do some levels show up in the list but others don’t? | Every level will show up in the list between the root of the schedule (Level 0 on top of the list) and the assigned level (on bottom of the list). |
Why are some levels disabled? | A level can only be selected down to where the milestone is actually assigned, no further. If multiple milestones are selected, the level is disabled unless available to ALL milestones. |
Density Zoom
Density zooming, like timeline zooming, will increase or decrease the amount of horizontal space that the schedule occupies; however, it will also automatically collapse/expand swimlanes as a means to condense the schedule into a lower density summary.
A swimlane will collapse as soon as any activity in the lane gets smaller than 16 pixels. A swimlane will expand as soon as any activity in the lane can be at least 16 pixels.
Activities that were “merged” or summarized together by the user (i.e., not by the swimlane) will not expand unless unmerged or unsummarized again by the user.
Timescale labels will change from "Set 1" to "Set 2" when 1 day gets smaller than 16 pixels and from "Set 2" back to "Set 1" when 1 day can be at least 16 pixels.

Timescale labels will change from "Set 2" to "Set 3" when 1 week gets smaller than 16 pixels and from "Set 3" back to "Set 2" when 1 week can be at least 16 pixels.

Top | Bottom | Unit | Trigger | |
|---|---|---|---|---|
Set 1 | Month/Year | Weeks | Days | Default |
Set 2 | Year | Month | Weeks | 1 day = 16 pixels (50%) |
Set 3 | Year | Quarter | Months | 1 week = 16 pixels (50%) |
Density Zooming In
Choose the Pan Hand from the toolbar.
Press D on the keyboard.
Click anywhere on the network diagram or in the timescale, keeping the mouse depressed.
Drag to the right.
Press D on the keyboard to go back to the regular Pan Hand.
Density Zooming Out
Choose the Pan Hand from the toolbar.
Press D on the keyboard.
Click anywhere on the network diagram or in the timescale, keeping the mouse depressed.
Drag to the left.
Press D on the keyboard to go back to the Pan Hand.
Zoom to Fit
Right-click anywhere on the canvas.
Choose Zoom to Fit.
